Fly, Modal, Vercel and Agent37: build speed, latency and cost compared
Results from 17 ten-minute trials, with measured ranges, resource settings and published-rate cost estimates.
Contents
- What we measured
- Build speed and command latency
- Which provider fits your task?
- Resource requests and hardware differences
- Integration defaults change the comparison
- Fly: a faster CPU tier can reduce cost per completed build
- The exact ten-minute schedule
- The network path is part of the experience
- Cost
- Performance versus cost and the Pareto set
- What failed, and how we treated it
- What this experiment can and cannot establish
- Data and reproduction instructions
We compared Fly.io, Modal, Vercel Sandbox and Agent37 through Agentastic's cloud integrations using the same ten-minute workload. This report covers build speed, client command latency, CPU throughput, file operations and estimated resource cost.

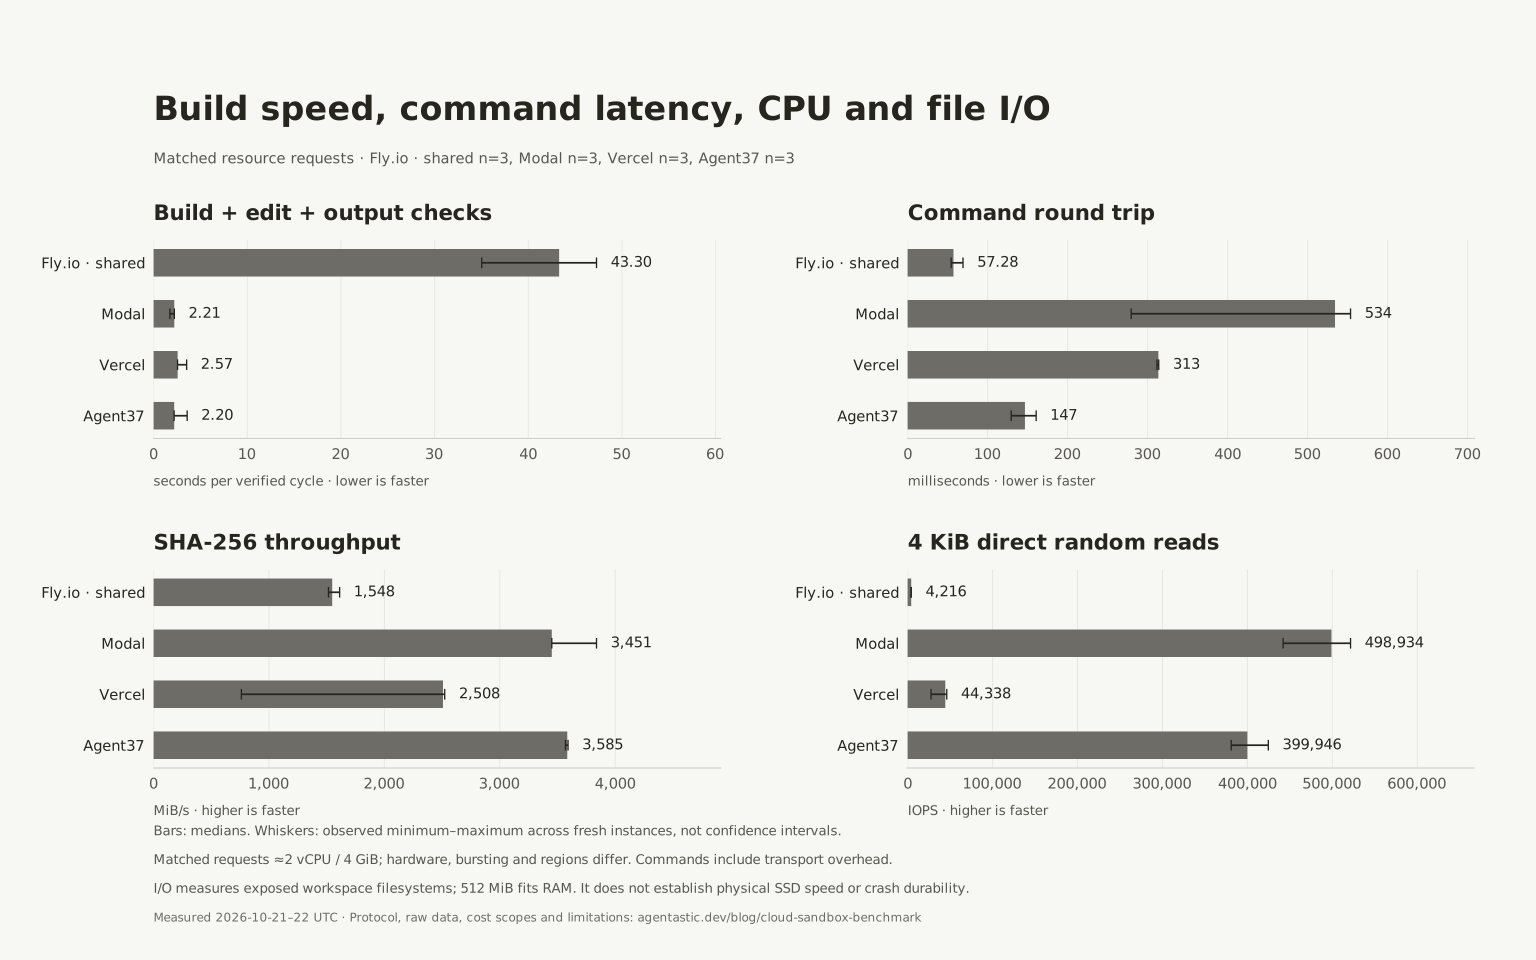
For this workload: Fly shared had the lowest client command latency (57 ms median); Agent37 and Modal had the fastest build cycles (about 2.2 seconds, with overlapping ranges); Vercel led small-file batch operations and the tested uploads; Agent37 had the lowest published resource-cost estimate. These results depend on the resource request, region and transport described below.
What we measured#
We completed 17 valid ten-minute trials: three matched-request repetitions per cloud, one integration-default run per cloud, and one exploratory Fly performance-CPU run. All 29 provisioned benchmark instances, including smoke and excluded attempts, received successful deletion acknowledgements. The interactive comparisons appear alongside the relevant findings below. Each published performance result must come from a completed 600-second workload on a fresh sandbox. Short smoke tests and failed attempts are recorded separately. The downloadable summary and per-run CSV are the underlying evidence.
Build speed and command latency#
The matched-request comparison contains three fresh, valid ten-minute runs per cloud, requesting approximately two vCPUs and 4 GiB RAM. Modal's request is one physical core. The build numbers come from the final four minutes, after the CPU and I/O phases; they are not fresh-VM first-build timings.
| Cloud | Runs | Verified build cycle, seconds: median [observed range] | Client command median | SHA-256 throughput |
|---|---|---|---|---|
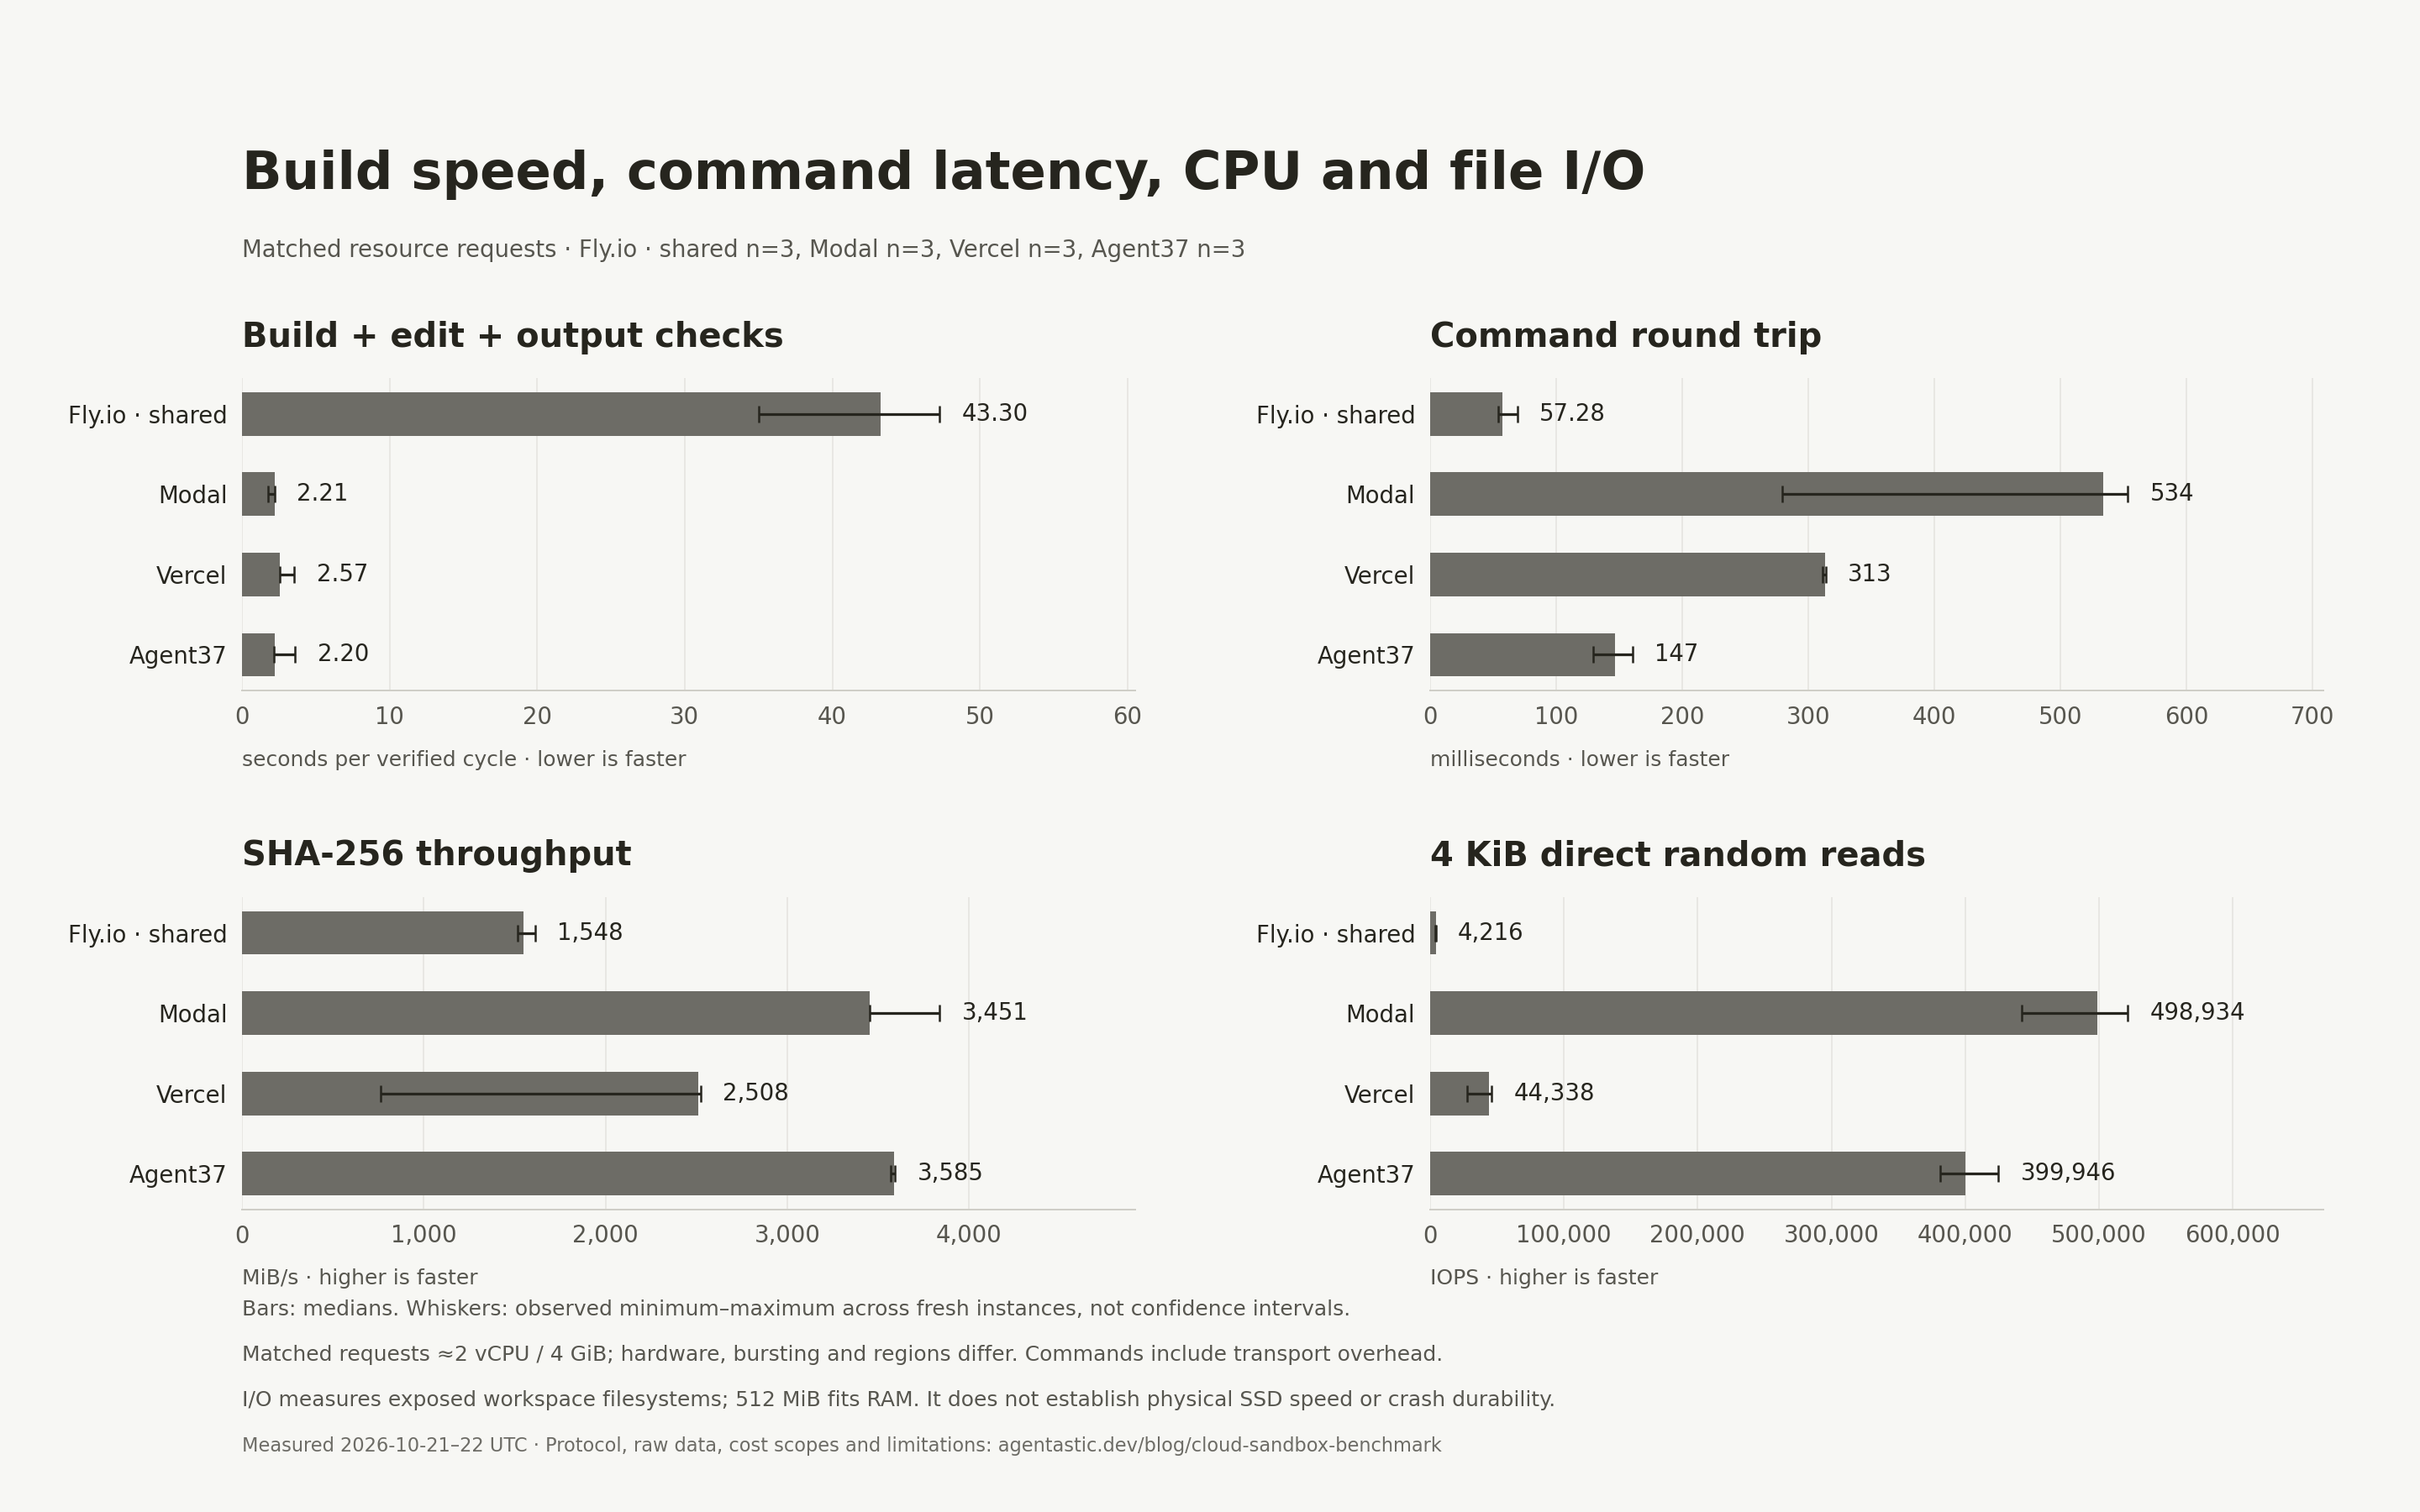
| Fly shared | 3 | 43.30 [35.03–47.29] | 57 ms | 1,548 MiB/s |
| Modal | 3 | 2.21 [1.74–2.21] | 534 ms | 3,451 MiB/s |
| Vercel | 3 | 2.57 [2.56–3.53] | 313 ms | 2,508 MiB/s |
| Agent37 | 3 | 2.20 [2.19–3.58] | 147 ms | 3,585 MiB/s |
Agent37 and Modal were the fastest build pair by median, with overlapping observed ranges. A 0.01-second median difference does not establish a dependable winner. Agent37 also had the lowest published resource-cost estimate for this shape. Fly had the lowest client command latency from our Mac, using its SJC placement. Those facts point to different choices depending on where a task spends its time.
Vercel's third repetition illustrates placement variability: its CPU throughput was about 761 MiB/s, versus 2,508–2,523 MiB/s in the other two. Its CPU brand string reported 2.50 GHz, compared with 2.90 GHz in those two instances. That label does not isolate the cause of the difference. Its three command medians stayed within 312–314 ms, so similar command latency did not predict similar compute speed. The CPU replay shows the first repetition; the range bars and raw files include all three.
Use the following as a starting point, then benchmark the constraint that matters in your own workload:
| Your priority | Start by evaluating | Evidence and boundary |
|---|---|---|
| Many sequential commands issued by your client | Fly shared | Lowest observed command median, 57 ms. Placement and transport matter; local agent tools use a different path. |
| Repeated builds and checks | Agent37 or Modal | About 2.2 seconds per verified cycle. Their ranges overlap; compare cost and your repository's memory needs. |
| CPU-heavy hashing | Agent37 or Modal; compare Fly performance separately | Highest matched-request median SHA-256 rates. These are two-minute, task-specific measurements. |
| Small-file changes or these file-upload payloads | Vercel | Highest observed batch-operation and upload medians. Full repository synchronization was not measured. |
| Random workspace-file reads | Modal, with Agent37 also worth testing | About 499,000 and 400,000 IOPS respectively on their exposed filesystems. This does not establish SSD speed or durability. |
| Lowest published resource cost for this shape | Agent37 | About $0.001251 per ten-minute window including requested CPU, RAM and disk. Actual bills depend on lifecycle and account terms. |
Storage and transfer results explain why the file-oriented choices differ:
| Cloud | 4 KiB random reads | Small-file batch operations | Single-file upload |
|---|---|---|---|
| Fly shared | 4,216 IOPS | 8,707 ops/s | 3.11 MiB/s |
| Modal | 498,934 IOPS | 43,991 ops/s | 1.42 MiB/s |
| Vercel | 44,338 IOPS | 128,585 ops/s | 18.20 MiB/s |
| Agent37 | 399,946 IOPS | 39,778 ops/s | 2.42 MiB/s |
These measure different paths through the sandbox. CPU quotas and filesystem implementations can limit application-visible I/O, and the working set fits RAM. A high random-read score does not automatically imply the fastest file creation, upload, or durable commit. The interactive controls expose sequential I/O, random writes, latency, fsync, and individual runs alongside these summaries.
Which provider fits your task?#
For interactive commands issued from your client, inspect command round-trip latency, first connection, and transfer time. Small delays can accumulate when an orchestrator sends each command over the network. An agent running entirely inside the VM does not pay this Mac-to-VM round trip for each local tool call. Our command measurements include SSH or SDK overhead; they do not measure model inference or the app's persistent tool/RPC channel.
For builds and test loops, start with seconds per verified development cycle. That combines a clean build, a prescribed source edit, an incremental build, and independent output checks. Then inspect CPU throughput over time and variability between fresh instances. A short initial burst can overstate the performance available later.
For dependency installation, code search, and file-heavy work, compare small-file operations and random I/O alongside sequential bandwidth. Scanning thousands of files behaves differently from reading one large file. Check fsync call latency and the storage service’s durability contract if your task frequently commits data; this experiment does not test crash consistency.
For long waits on models or external services, inspect the billing model. Allocated-memory charges, minimum resource requests, and retained disk can matter more than peak compute throughput. This benchmark measures an idle phase but does not run LLM calls, so it cannot rank model latency or model quality.
For persistent workspaces, consider what survives sleep and restart and what continues billing. The performance workload is not a checkpoint-preservation test. An application that needs in-memory processes restored requires a separate lifecycle evaluation.
Compare performance measurements
Select a task
2.2 s / cycle · 3 runs. This is a starting point for this workload, not a universal winner. Inspect cost and variation below.
Observed ranges overlap with Modal, Vercel. This sample does not establish a reliable lead over those providers.
Build + edit + test
↓ Lower is betterOne verified clean build, prescribed edit, incremental build, and output checks. Lower is faster.
Bars show the median of per-run measurements; dark whiskers show the minimum and maximum across fresh instances. All axes start at zero. Select a provider to inspect its runs.
Returned size: 2 vCPU / 4 GiB RAM. CPU models observed: unknown. Visible CPUs and provider requests do not guarantee equal sustained capacity.
| Run | s / cycle | Initial RPC attempt | Cleanup | Observed session USD | Evidence |
|---|---|---|---|---|---|
| 1 | 3.58 | Connected | deleted | $0.00125 | Raw JSON |
| 2 | 2.2 | Connected | deleted | $0.00125 | Raw JSON |
| 3 | 2.19 | Did not connect | deleted | $0.00125 | Raw JSON |
Inspect every result and download the evidence
| Provider | Runs | Provision / s | Command p95 / ms | CPU / MiB/s | Random read / IOPS | Dev cycles / 4 min |
|---|---|---|---|---|---|---|
| Fly.io · shared | 3 | 39 | 95 | 1,548 | 4,216 | 5 |
| Modal | 3 | 2.97 | 581 | 3,451 | 498,934 | 104 |
| Vercel | 3 | 55 | 451 | 2,508 | 44,338 | 89 |
| Agent37 | 3 | 1.99 | 213 | 3,585 | 399,946 | 101 |
Download CSV · Summary, environments & pricing sources · Reproduction harness
Complete report bundle · Shareable chart · SVG · PNG
12 smoke or incomplete attempts were excluded from performance charts. Their status and cleanup outcomes are retained in the summary JSON.
Resource requests and hardware differences#
Agentastic exposes common CPU, memory, disk, and lifecycle settings, but providers interpret those requests differently. The integration-default profile means our generic VMSpec() request through the configured integrations; it does not omit every vendor's resource parameters or claim to reproduce every provider's native defaults.
Our matched-request profile asks for roughly two vCPUs and 4 GiB RAM. Modal describes CPU in physical cores, so it receives one physical-core request. Fly receives two shared vCPUs. Agent37's default instance also shares hardware and can be limited under sustained load, according to its billing documentation. Vercel receives two vCPUs, with memory tied to that shape. Agent37 receives its smallest 2-vCPU / 4-GB shape. Those are comparable CPU/RAM requests, not promises of equivalent hardware or sustained capacity. The common disk setting is not a matching block-volume allocation across the APIs: we measure each sandbox’s workspace filesystem and retain its reported filesystem metadata.
Modal's resource documentation explains that CPU and memory can burst above requests and billing uses the higher of requested or actual usage. Fly's CPU documentation distinguishes burstable shared CPU from performance CPU. Vercel's pricing documentation explains its active-CPU and allocated-memory model. Agent37's sizing documentation specifies the supported shapes and current four-vCPU ceiling.
This review also found a mismatch in our integration: Agent37's larger CPU options still offer 8 and 16 vCPUs, whereas its current API documents capping those requests at four while retaining requested RAM. The baseline avoids those sizes. We record runtime visibility and cgroup limits rather than assume the request describes the allocation perfectly.
Integration defaults change the comparison#
We also ran one fresh instance per cloud using Agentastic's generic defaults through each integration. These are one-run checks, separate from the repeated matched-request comparison.
| Integration default | Returned request | Verified cycle | Completed cycles in four minutes | Ten-minute resource estimate |
|---|---|---|---|---|
| Fly shared | 1 vCPU / 2 GiB | 96.08 s | 2 | $0.00351 |
| Modal | 1 physical core / 2 GiB | 2.23 s | 103 | $0.03166+ floor |
| Vercel | 1 vCPU / 2 GiB | 4.93 s | 47 | $0.00707–$0.02840 envelope |
| Agent37 | 2 vCPU / 4 GB | 2.18 s | 105 | $0.001251 including disk |
Fly and Vercel's smaller CPU requests had slower observed build loops than their matched-request runs. Their lower time-based rates did not buy the same amount of completed work. Modal's check used the same CPU request and half the requested memory, with a similar cycle time for this fixture; that is a useful rightsizing candidate to retest. Agent37 resolved the generic request to its smallest supported 2-vCPU / 4-GB shape.
Resource settings and placement both differed between these fresh instances. One trial cannot isolate the effect of a CPU or RAM change, and this fixture does not establish the memory needs of a larger repository.
Fly: a faster CPU tier can reduce cost per completed build#
The clearest tier lesson came from Fly. Our three matched-request runs used two shared vCPUs and 4 GiB RAM. A separate exploratory run used two performance vCPUs and the same RAM, in the same SJC region.
| Fly CPU tier | Fresh runs | Median verified cycle | Completed cycles in four minutes | Estimated ten-minute compute | Estimated development-phase cost per completed cycle |
|---|---|---|---|---|---|
| Shared | 3 | 43.30 s | 5 | $0.00701 | $0.000561 |
| Performance | 1 | 3.42 s | 67 | $0.01822 | $0.000109 |
The performance request cost about 2.6 times more per unit of time, yet its observed cycle was 12.6 times faster and its estimated cost per completed cycle was 5.2 times lower. The cycle-cost calculation charges the entire four-minute development phase, including unfinished work and gaps, then divides by verified cycles. Both Fly estimates exclude IP and egress charges. One performance run is an exploratory check, not a measurement of that tier's variability.
The CPU replay explains why a quick smoke test can miss this distinction. In the first shared-CPU repetition, average throughput fell from about 2,945 MiB/s in the first 20 seconds to 268 MiB/s in the last 20 of the CPU phase. The performance run averaged 2,972 and 2,989 MiB/s, respectively, over those same slices. These observations are consistent with Fly's documented shared-CPU burst mechanism; we did not collect the provider's burst-balance metrics and cannot identify the exact balance at each instant.
For an agent that spends most of its time waiting and runs occasional commands, shared CPU may still be a sensible choice. For repeated builds, size the tier against completed work. In this experiment, choosing solely by hourly rate would have selected the more expensive way to finish a build.
CPU throughput during the two-minute phase
First repetition per provider, sampled throughout the 120-second CPU phase. Line patterns identify providers; playback reveals changes during the phase.
A two-minute CPU phase cannot establish hours-long sustained performance. Shared-host load and burst balance can change the outcome.
The exact ten-minute schedule#
| Window | Workload | What it tells us |
|---|---|---|
| 0–60 seconds | Idle baseline | Resource use when the sandbox is waiting |
| 60–180 seconds | Two workers repeatedly hash a fixed 1 MiB buffer | CPU throughput and changes over time |
| 180–300 seconds | Direct sequential and random fio reads/writes | Exposed filesystem bandwidth, IOPS, and operation latency |
| 300–360 seconds | Small-file operations plus fsync-call probes | Metadata performance and fsync latency |
| 360–600 seconds | Repeated clean build, edit, incremental build, and output checks | Correct development cycles completed in a fixed window |
The development fixture contains 80 TypeScript modules and 3,200 small functions. Every sandbox uses Node 22.20.0 and TypeScript 5.9.3. The fixture is deliberately portable: our native macOS application cannot provide an identical build task on these Linux services. The task contains no model-generated code, no user repository, and no private source.
Preparation verifies Node's archive checksum, installs the pinned compiler, and initializes the disk-test file. Preparation time is recorded separately. It does not consume the timed workload window. We also time the real Swift provider's provisioning call and attempt a real remote-server connection. That initial RPC attempt bypasses the workspace manager's SSH warm-up retries and happens before source transfer; it is a diagnostic, not the full app-launch experience or a service-availability test. Time to first benchmark command includes this attempt and retries until the first successful benchmark command. Some initial RPC attempts failed before SSH warmed up and returned earlier than successful deployments, so this metric does not rank full workspace readiness. The per-run tables expose those outcomes.
Median provider createVM call times were 2.0 seconds for Agent37, 3.0 for Modal, 38.6 for Fly shared, and 55.3 for Vercel. These include each integration's bootstrap steps and cannot be treated as vendor-only VM cold-boot times.
Disk tests use a 512 MiB file, direct I/O, one job, queue depth one, 1 MiB sequential blocks, and 4 KiB random blocks. The four slots each occupy 30 seconds, including command overhead. This is filesystem performance exposed to a sandbox, not a measurement of an isolated physical SSD. direct=1 requests the filesystem’s direct-I/O path; it does not prove that every provider bypasses every host cache. The 512 MiB working set also fits within the requested RAM. It is initialized during preparation, and sequential reads precede random reads; we do not flush provider host caches between slots. Very high IOPS here should guide workspace operations, not be read as a durable-database or physical-drive claim. Distribution-provided fio versions and filesystem type identifiers are recorded with each run. See fio’s own documentation for the direct-I/O option.
Small-file batches create, stat, read and verify, rename, and delete 128 files. A separate probe writes a 1 KiB file and times its fsync. A quick return measures the exposed filesystem’s response, without proving persistence across a host failure. The fio write numbers do not imply every operation has been durably committed.
The network path is part of the experience#
Fly uses SSH through its public endpoint. Modal exposes an SSH tunnel. Agent37 carries SSH over an authenticated WebSocket. Vercel uses SDK file APIs and HTTPS commands; Agentastic's workspace RPC uses its separate HTTPS/WebSocket bridge.
We measure 20 command probes before the workload and 20 afterward. SSH probes reuse a ControlMaster; Vercel reuses a local SDK driver. This compares the command transport used in the benchmark. Probes run before and after the busy workload, so they do not establish responsiveness under CPU or I/O contention. They are not a pure datacenter network RTT or a measurement of agent tool RPC latency. In particular, Vercel's SDK command latency should not be read as the latency of Agentastic's separate persistent RPC bridge.
Uploads and downloads use identical 1 MiB and 8 MiB payloads with SHA-256 verification. Their timings include transfer and API overhead. These are single-file payloads that repeat a deterministic 32-byte pattern, not full repositories or incompressible data. The small samples show behavior of these transport paths; they do not establish maximum network bandwidth or repository synchronization speed. Source preparation, credentials, and provider-specific bootstrapping also affect an application's end-to-end launch time.
Cost#
We separate the 600-second workload from the full create-to-delete session. The latter also includes startup, preparation, transport probes, result collection, and teardown. Neither elapsed time is automatically identical to the provider's billable clock.
The visualization labels each cost figure by what it supports:
- Fly: regional shape-rate estimates, once placement and pricing are verified. Dedicated IPv4, egress, and other resources are additional.
- Modal: a minimum based on requested resources at Sandbox rates. Burst usage and region premiums can increase the charge.
- Vercel: an idle-to-full-CPU pricing envelope using allocated memory and the default region's active-CPU rates. This envelope is not an observed billing interval.
- Agent37: its default-instance CPU, RAM, and provisioned-disk rates, with minute-level metering. Disk continues billing while an instance is retained asleep.
For the matched-request shapes, the published rates imply the following. The 1,000-window column is simple multiplication, not a measured batch bill or a volume discount.
| Cloud | Ten-minute resource cost | 1,000 ten-minute windows | Meaning |
|---|---|---|---|
| Fly shared, SJC | $0.00701 | $7.01 | Regional compute estimate; IP and egress extra |
| Modal | $0.03966+ | $39.66+ | Requested-resource floor; burst and region premiums extra |
| Vercel, IAD | $0.01413–$0.05680 | $14.13–$56.80 | Allocated RAM plus idle-to-full active CPU envelope |
| Agent37 | $0.001251 | $1.25 | Default-instance CPU, RAM, and reserved disk estimate |
Agent37 has the lowest published resource estimate among these shapes, including their differing cost scopes. Its usage API also reported $0.001251 per successful instance in the snapshots taken after deletion. Those snapshots cover each instance's full lifetime, including preparation; settlement can lag, so they are neither ten-minute-only measurements nor final invoices.
These are published-rate estimates, not invoice totals. Included credits, subscriptions, taxes, network traffic, preparation, retained snapshots, and account-specific prices can change actual charges. We do not call an estimate an actual charge. See the dated sources in the rate manifest, Fly pricing, Modal pricing, Vercel pricing, and Agent37 billing.
Cost per successful cycle is meaningful only when its cost scope and successful work are defined consistently. Comparing a compute-only minimum on one cloud with an all-inclusive invoice on another would produce a misleading ranking.
Cost
Published-rate estimates for the workload window. Floors and bounds are intentional: CPU billing differs across clouds, so these are not four comparable invoice totals.
| Provider | Matched request ≈2 vCPU / 4 GiB · 3 runs each | Integration defaults 1 run each | Fly performance CPU 2 vCPU / 4 GiB · 1 run |
|---|---|---|---|
| Fly.io compute only; IP and egress excluded | $0.00701rate estimate2 vCPU / 4 GiBPer verified cycle: $0.00056 | $0.00351rate estimate1 vCPU / 2 GiBPer verified cycle: $0.00070 | $0.0182rate estimate2 vCPU / 4 GiBPer verified cycle: $0.00011 |
| Modal compute only; burst usage and region premium excluded | $0.0397+request floor1 physical core / 4 GiBPer verified cycle: $0.00015+ | $0.0317+request floor1 physical core / 2 GiBPer verified cycle: $0.00012+ | Not measured |
| Vercel default-region compute only | $0.0141–$0.0568idle-to-full CPU bounds2 vCPU / 4 GiBPer verified cycle: $0.0000635–$0.00026 | $0.00707–$0.0284idle-to-full CPU bounds1 vCPU / 2 GiBPer verified cycle: $0.0000601–$0.00024 | Not measured |
| Agent37 compute + retained instance disk | $0.00125rate estimate2 vCPU / 4 GiBPer verified cycle: $0.0000050Full-session usage snapshot: $0.00125 (settlement may lag). | $0.00125rate estimate2 vCPU / 4 GiBPer verified cycle: $0.0000048Full-session usage snapshot: $0.00125 (settlement may lag). | Not measured |
Observed session charges, when available in the run table, come from the provider usage API after deletion and include the entire instance lifetime. Settlement may lag; these are separate from the ten-minute estimates and are not invoices. Published-rate estimates, floors, or bounds. No invoice reconciliation. Setup, egress, snapshots and plan fees excluded. Prices checked 2026-10-21. Verify your region, plan, credits, and retained-storage charges.
Performance versus cost and the Pareto set#
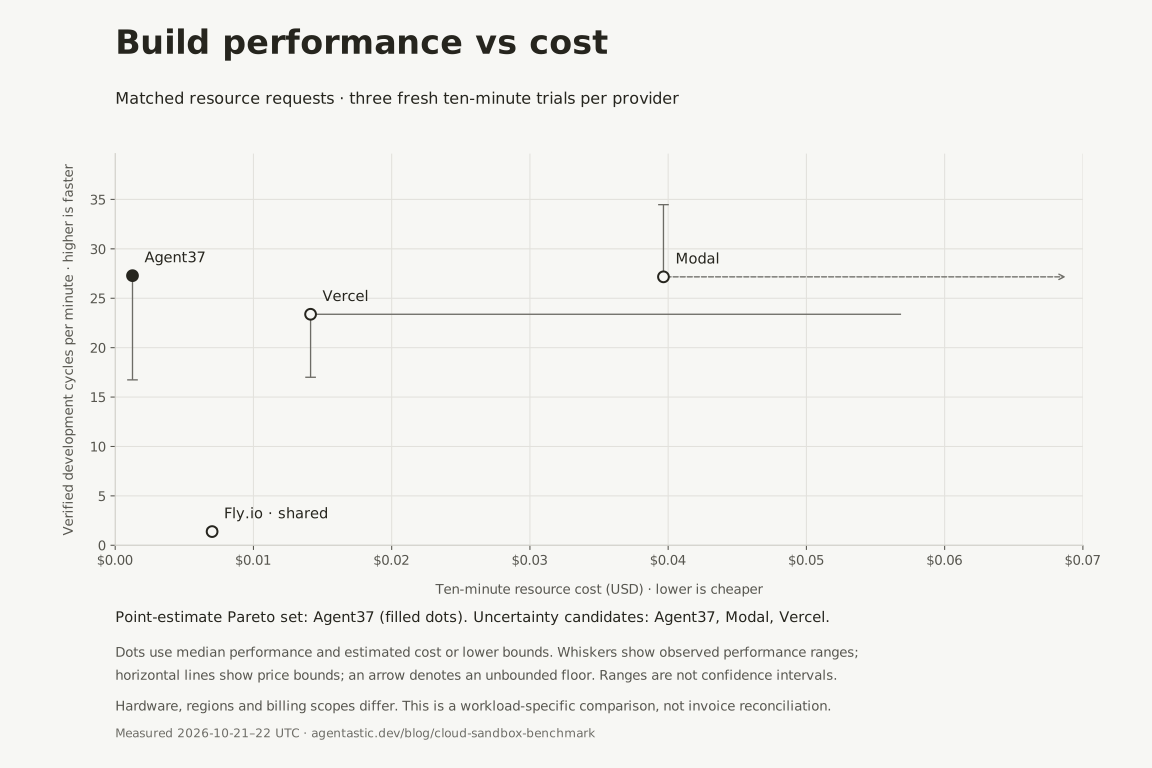
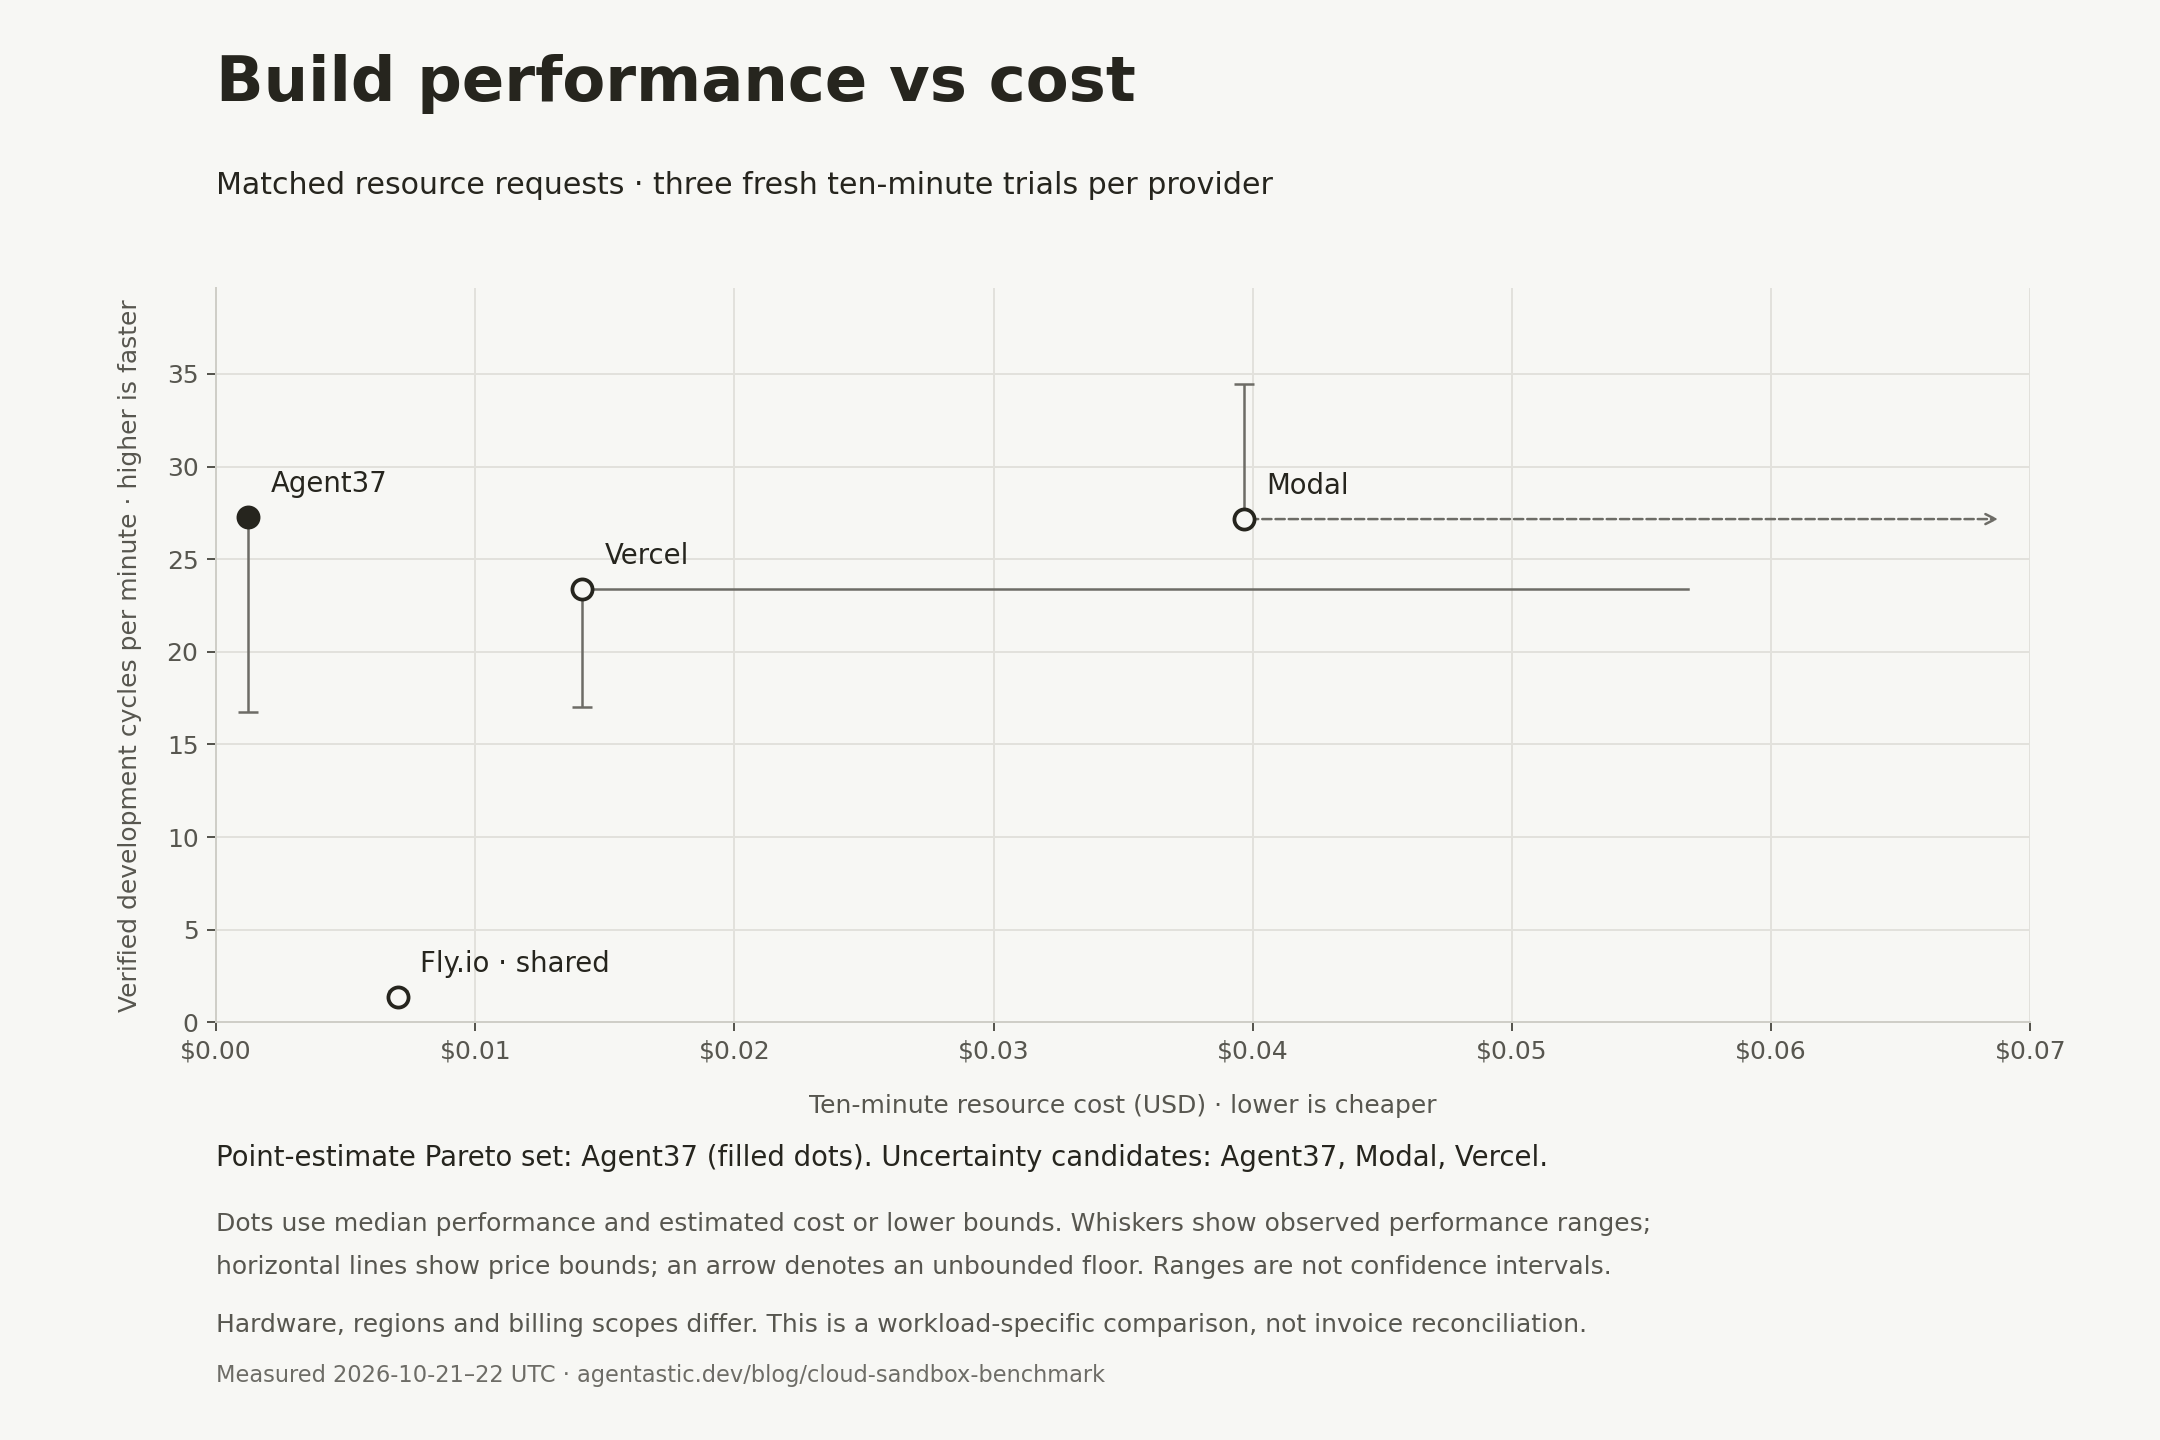
A provider is Pareto-optimal for a particular comparison when no other provider is both cheaper and faster, with at least one strict improvement. The plot below uses only the three matched-request trials per provider. Its default performance measure is verified development cycles per minute, calculated as 60 divided by median cycle time; cost is the estimate or lower bound for the entire ten-minute resource window. This avoids calling the ten-minute CPU/idle/I/O mix a build-only charge. You can also compare CPU hashing or small-file operations.
At those plotted build medians and cost estimates, Agent37 is the only point-estimate Pareto member. That does not establish a reliable performance lead: Agent37, Modal and Vercel remain uncertainty candidates when their observed ranges and price bounds are considered. Fly shared is dominated within these recorded bounds. For small-file operations, Agent37 and Vercel form the point-estimate Pareto set instead. The choice therefore changes with the workload.
The uncertainty calculation only removes a provider when another is no more expensive even at its highest documented cost bound, and no slower even at its lowest observed performance, than the target at its cheapest and fastest bounds. Modal's unbounded cost floor cannot prove such domination. These are comparisons within this dataset, not confidence intervals or future guarantees; different cost scopes, placement and host conditions still limit the conclusion.
Performance vs cost
One dot per provider, using the three matched-request trials each. Prefer the upper-left: more work per unit of time and lower estimated resource cost.
Dots use median performance and the cost estimate or lower bound. Vertical whiskers show observed per-run performance ranges; horizontal lines show published price bounds. An arrow means a floor with no upper bound, rather than a measured price. Filled dots and their connecting line indicate the point-estimate Pareto set. Axes start at zero.
Point-estimate Pareto set: Agent37. No other plotted provider is both cheaper and faster, with at least one strict improvement, at those particular values.
Uncertainty candidates: Modal, Vercel, Agent37. These cannot be ruled out using the observed performance ranges and price bounds. To remove a candidate, another provider must remain cheaper and faster even at its own worst bounds and the candidate’s best bounds. These are descriptive bounds, not confidence intervals or a guarantee about future runs.
Agent37: 27 cycles/min, observed range 17–27. Cost $0.001251 per ten-minute window.
rate estimate: compute + retained instance disk. Three fresh runs; approximately two vCPUs and 4 GiB requested (Modal: one physical core). Regions, hardware and billing scopes differ. This is a workload-specific estimate, not an invoice comparison.
| Provider | cycles/min | 10 min / USD | Pareto set |
|---|---|---|---|
| Fly.io · shared | 1.39 [1.27–1.71] | $0.007010 | Dominated within these bounds |
| Modal | 27 [27–34] | $0.03966+ | Uncertainty candidate |
| Vercel | 23 [17–23] | $0.01413–$0.05680 | Uncertainty candidate |
| Agent37 | 27 [17–27] | $0.001251 | Point-estimate set |
Download the Pareto calculations or the build-performance plot as SVG or PNG.
What failed, and how we treated it#
Two Vercel attempts and one Agent37 attempt were excluded from the full-run performance comparison:
- Vercel's first synchronous command response ended with
terminatedafter the workload entered its metadata phase. The underlying cause was not established. - A detached Vercel retry completed the payload in 600.018 seconds, but SDK metadata reads retained a null exit code. The controller reached its deadline without collecting the final command probes. We excluded the attempt, corrected completion handling with bounded
command.wait()calls, added regression tests and a one-second live preflight, and reran the workload. - Agent37's first integration-default attempt lost its SSH connection near the end. Its underlying cause was not established. A fresh retry completed and passed validation.
All three excluded instances were deleted successfully. Nine 30-second smoke attempts were also excluded; those exercised lifecycle and controller setup, including rootless fio installation and SSH socket-path handling. The downloaded summary retains excluded-attempt timestamps, status, reason, and cleanup outcomes.
Smoke tests and successive harness corrections are not random samples of service availability. These failures matter operationally, but the counts do not establish a provider-wide failure rate. Failed and smoke attempts also consumed resources; our cost tables describe accepted workload windows rather than the total bill for developing and running this experiment.
What this experiment can and cannot establish#
Fresh-instance repetitions reveal some variability from placement and shared-host contention. The charts give each fresh instance equal weight. For command and build-cycle latency, we first compute a median within each run, then take the median across runs. Whiskers span those per-run values, not individual operation extremes. CPU throughput and fio results are summarized per run before the same across-run aggregation. These observed minimum and maximum values are not confidence intervals. Within-run p95 latency comes from the collected command or I/O operations; three machines do not establish a provider-wide p95 startup distribution.
The host client, its network, region selection, image-cache state, and provider bootstrap all affect timings. Fly, Modal and Agent37 received the versioned docker.io/agentastic/cloud-base:v2026.10.07-1 image request; Vercel uses its provider runtime. The controller used the app-managed Modal SDK 1.2.6 and Vercel Sandbox SDK 2.2.1. Vercel's current documentation also covers SDK 3.x image flows; those are outside the installed integration path measured here. The export includes a registry digest checked during the experiment, while per-instance pulled image digests were not reported by the providers. We retain the exact CPU model, architecture, kernel, tools, resource-limit visibility, payload hash, and run timestamps. The manifest records the base Git revision and whether the working tree was modified; the downloadable source archive and per-file SHA-256 hashes identify the exact harness used. Provider resource counters expose different scopes and limits, so their memory samples are diagnostic rather than a ranking of memory efficiency. Default-region placement is not controlled cross-provider geography. A fresh instance does not imply an uncached image; earlier smoke tests can warm provider image caches. Preparation can also spend shared-CPU burst credits before the timed phase, so results describe this complete preparation protocol rather than an untouched CPU-credit balance.
SHA-256 throughput is a specific CPU workload influenced by instruction support and hardware acceleration, not a universal CPU score. The CPU phase lasts two minutes. That is useful for spotting changes during the phase but insufficient to establish hours-long sustained throughput or a complete shared-CPU burst policy. The development phase lasts four minutes. Rankings apply to this particular fixture and schedule, not every programming language or repository.
This version does not evaluate LLM quality, concurrent-agent scaling, model inference latency, memory-checkpoint restoration, or long-term service reliability. RPC connection failures and cleanup failures remain visible and should be considered separately from valid compute measurements.
Data and reproduction instructions#
The opt-in live test is CodeEditTests.CloudBenchmarkLiveTests. It reads configured cloud accounts, provisions fresh resources through our actual Swift providers, runs the payload, and awaits deletion. Ordinary test runs skip it. No model login or application repository is copied to the instances.
The harness lives under scripts/perf/cloud/, with its complete commands, scheduling details, exclusion rules, and accounting assumptions in the README. The export contains only sanitized evidence: it excludes cloud account IDs, resource IDs, credentials, SSH keys, and host mount paths. Private operational manifests remain local so a resource can be found if the test host is externally interrupted.
Download the complete evidence bundle, reproduction source, or CSV. Shareable matched-request figures are available as SVG and PNG; the separate defaults comparison is also available as SVG and PNG.
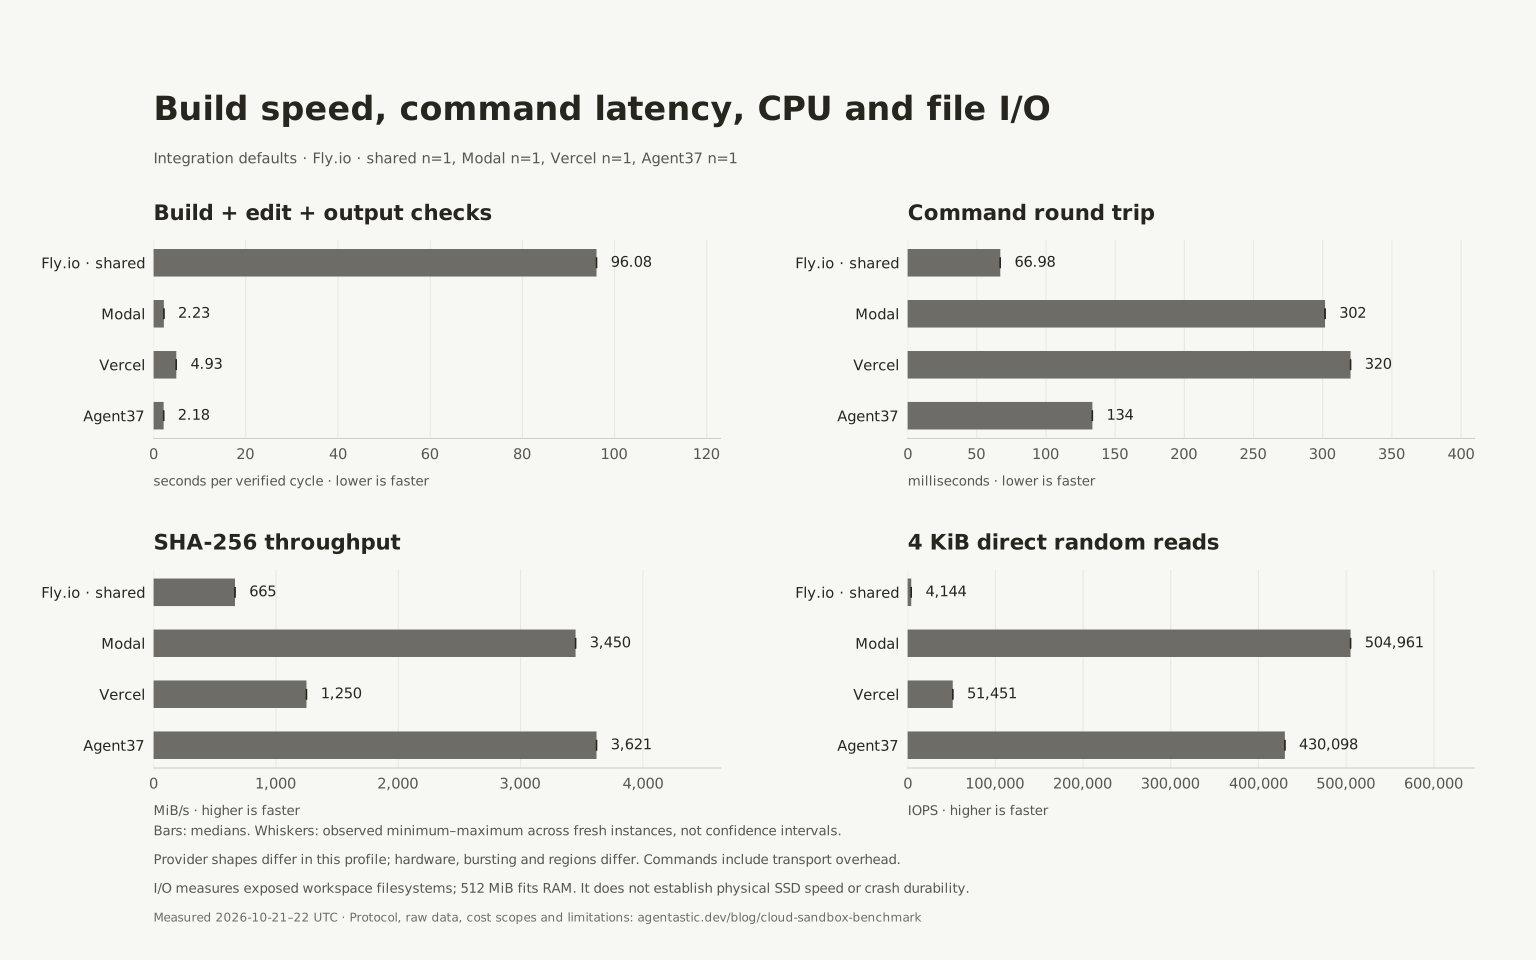
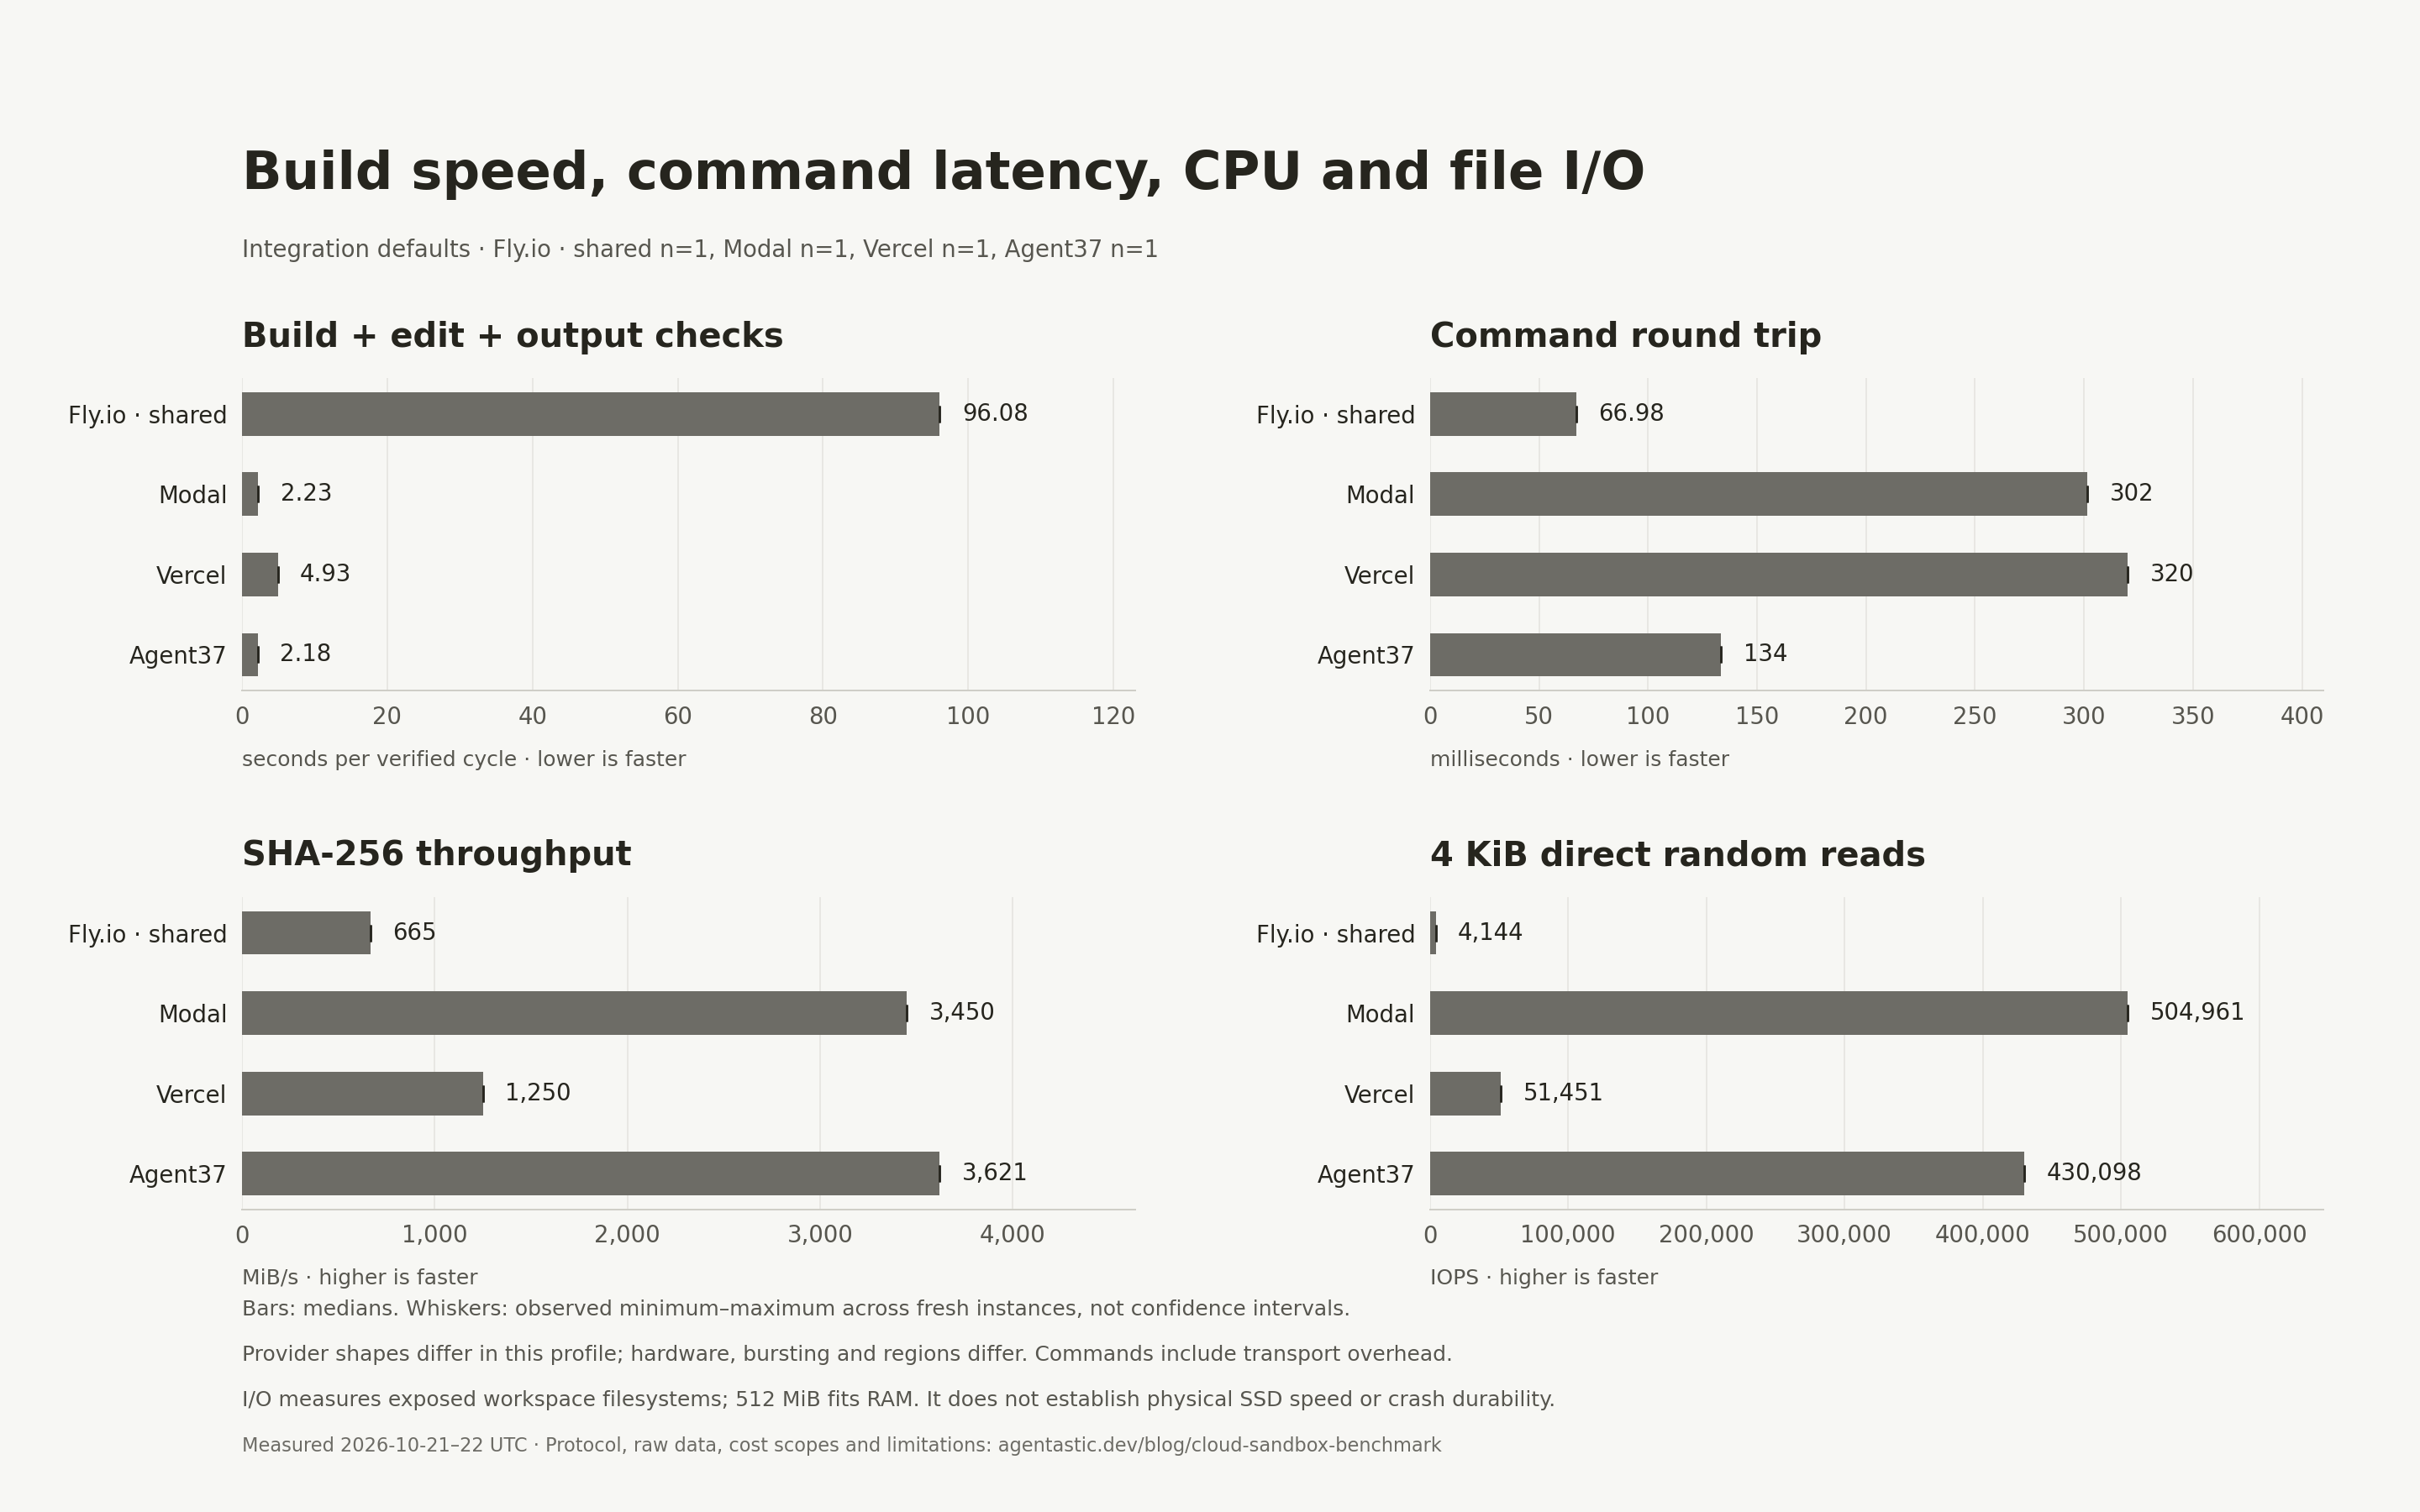
Each chart links back to the measurements it displays. Readers can switch workloads, inspect every repetition, replay the CPU trace, and compare latency and I/O before deciding which cloud to try for their own task.